Dashboards
I enjoy creating dashboards on topics that interest me. Most of them are hosted on my Tableau Public site, but you can find them below as well. Sometimes you’ll find me highlighting them on Twitter.
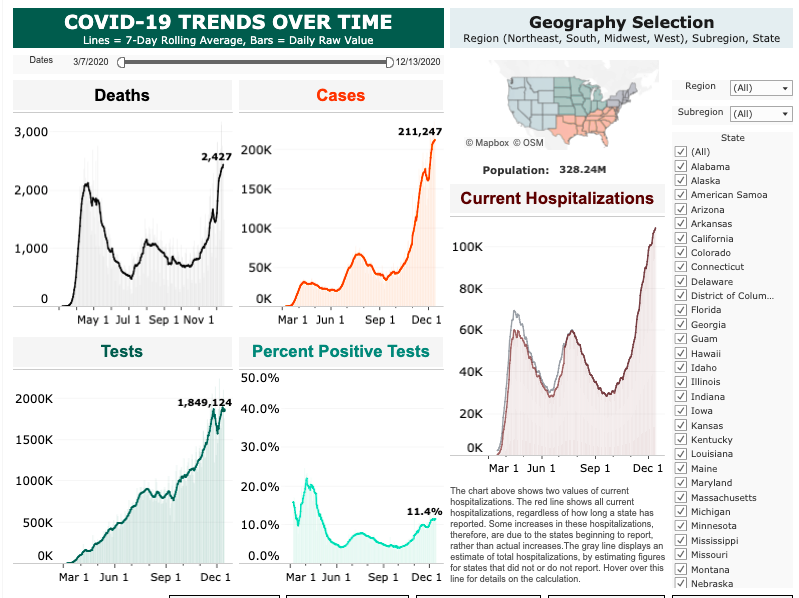
COVID-19 Daily Statistics
This dashboard uses data from the Department of Health and Human Services, and the Centers for Disease Control and Prevention to display trends in COVID-19 cases, deaths, hospitalizations and tests. Click here to view the dashboard.
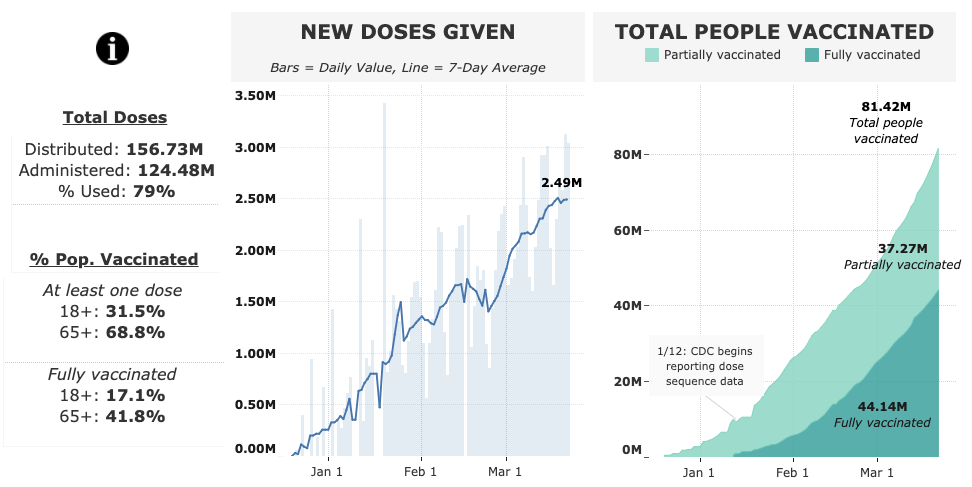
COVID-19 Vaccine Distribution
This dashboard presents data from the CDC on vaccine distribution and administration in the United States, with the aim of tracking the US’ ramp-up of vaccination capacity.Click here to view the dashboard.
Additional COVID-19 analytics
These are analyses I have created that are now automatically updated on a regular basis.
- CDC Excess Deaths Dashboard
- New York City COVID-19 Analysis
- Massachusetts COVID-19 Analysis
- Google Trends
- Omicron Variant: South Africa COVID-19 Analytics (no longer updating)
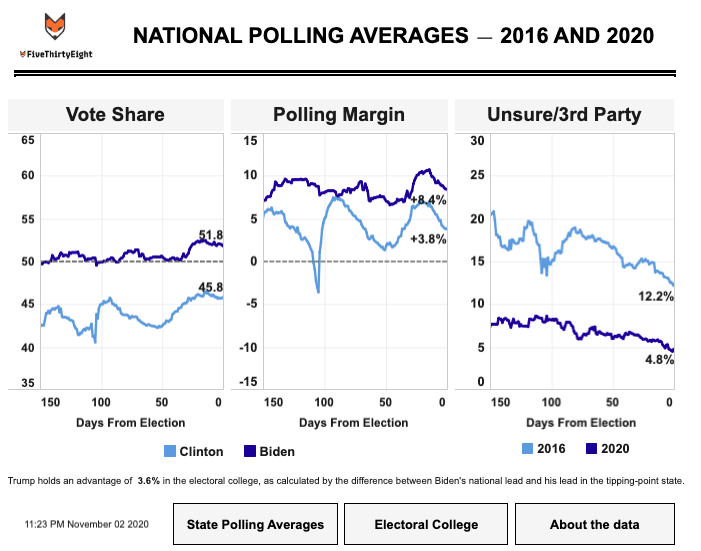
2020 Election: Presidential Polling Averages
This dashboard used data from FiveThirtyEight to compare presidential polling averages at similar points in the 2016 and 2020 presidential elections. Click here to view the dashboard.
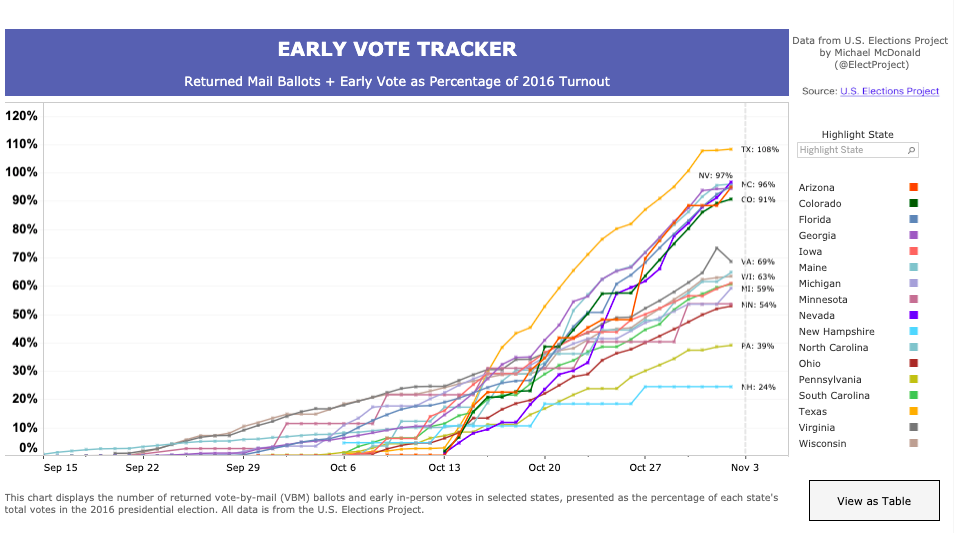
2020 Election: Early Vote Tracker
This dashboard used data from Michael McDonald and the U.S. Elections Project, tracking vote-by-mail and early voting trends in the 2020 general election. Michael’s site only provided a snapshot of early voting trends, so I cached the daily data to show trends over the course of the full run-up to the election. Click here to view the dashboard.